
 The Effect of Cigarette Taxes on Health Care Expenditures Essay
The Effect of Cigarette Taxes on Health Care Expenditures
I. Introduction
The topic of this paper is stated as follows: “The Effect of Cigarette Taxes on Health Care Expenditures”. It is aimed at discovering the degree of relationship between the amounts of cigarette taxes collected in the USA and health care expenditures rate (HCE) in the given country in the period between 2010 and 2013. The data for this empirical paper will be collected from the trusted resources, most of which are national and profile organizational reports that can give reliable data even with its analysis. However, in this paper, the analysis of data will be provided independently. In order to reach the aim of the paper, the following objectives are stated to be applied practically for the successful implementation of this study:
- Present a rich literature review based on the recent sources that will help reach an understanding that smoking related issue is serious, as it is related to many social and healthcare problems, especially if it concerns kids and youth.
- Collect empirical data from the trusted resources.
- Set up the array of data in order to get it classified and stratified into dependent and independent variables. Provide each category with the value.
- Create a relevant mathematic model with statistical elements, so that all data can be subjected to some mathematic law.
- Provide the OLS linear regression in STATA, following the guidelines of this software in order to reach positive results.
- Describe the data and its input into STATA
- Analyze the data according to the STATA tables, following the basic rules of the analysis.
This paper will contribute to a better understanding of the basic principles of data collecting, implying descriptive and productive methods of analysis. STATA will help to categorize data according to the chosen criteria in order to operate with the facts.
II. Literature Review
The problem of tobacco smoking is of vital importance for the developing and developed countries of the world, as it presents a significant problem that should be solved at the governmental level to set up social benefits. Particularly, each year in the USA approximately 480,000 people die from cigarette smoking and exposure to the secondhand tobacco smoke. This problem matters much in the context of instilling smoking habits in kids. According to “Toll of tobacco in the United States of America” (2014), today in the U.S. there are 5.6 million kids under 18, who will presumably die from smoking. This problem is vivid in the frames of the absence of constraints in the modern society, where even kids are addicted to alcohol, drugs, and smoking that in many cases lead to the violent behavior.
The rate of tobacco consumption varies according to age, state, gender, income and education levels. For instance, Koch (1992), Connelly, Goel, & Ram (2009), Forster & Jones (2001), and, Goel, and Ram (2009) find that under the higher per capita income level, the rate of cigarette consumption is lower, as people are trying to get rid of this habit, or even decide not to try cigarettes at all. They know perfectly well that cigarette consumption is a hard test for health.
Tobacco use is also related to financial risks of health insurance. Some people are not ready to pay more for such a risk. Indeed, Cebula (2010) the Goel (2008) find the relation between insurance and smoking habit, pointing out that the higher the % of the uninsured people is, the lower the rate of tobacco smokers.
However, when “in 2009, historic legislation granted the US Food and Drug Administration (FDA) the authority to regulate the production, sale, and marketing of tobacco products” (American Cancer Society, 2014), the situation improved in terms of the governmental control of tobacco taxation. This allowed collecting taxes on the regular basis in an adequate amount so as to support the field of healthcare with the help of the amounts collected. In spite of this fact, many tobacco manufacturers were dissatisfied with such a solution, which led to the impulse in the healthcare finance. For instance, in the USA, “total annual public and private health care expenditures caused by smoking: at least $132.5 billion” (“Toll of tobacco in the United States of America,” 2014). It helps many people get the Medicaid.
There is no secret that tobacco smoking causes many diseases that may cause death (breast and lung cancer, bronchitis, heart diseases, etc.). In many cases, kids are served with the first cigarette without any assumption of the risk they take. They do not even realize the danger of cigarette flavors and menthol they contain in terms of the risk of heart and breathing diseases. Second-hand smoking causes even more trouble for people around, that is why in many hotels, restaurants and other public places, smoking is prohibited by the law or administrators. Acscan.org provides relevant information not only about the danger of traditional smoking, but also about e-cigarettes that have become very popular since 2013, however, their impact on health is still not explored (American Cancer Society, 2014). Therefore, the danger of smoking is explicitly displayed in the experience of many countries of the world, and particularly in the USA, where health expenditures reached over 17% of the total GDP, according to the recent data of the World Bank. In particular, health care expenditure “covers the provision of health services (preventive and curative), family planning activities, nutrition activities, and emergency aid designated for health but does not include provision of water and sanitation” (The World Bank, n.d.). All these features are available according to the needs of the residents of the USA in order to keep up with the necessity to change the situation with prevention and treatment of diseases for the better. There was no surprise for journalists to report about spending of “$2.9 trillion on health care in 2013” that is pretty close to 18% of the U.S. national economy (Young, 2013). The attempts of the government can be proved by the data from numerous national reports, including Centers for Disease Control and Prevention 2013 annual report, American Cancer Society 2014 report, National Health Care Expenditures CMS 2012 report, etc. The empirical data for this study will be collected on the basis of these reports in order to run a linear regression with an independent and dependent variables. The data will help reach the main goal of this paper and trace the relation between tobacco taxation and healthcare expenditures in different years in the period of 2010-2013.
III. Theory / Empirical Specification
The data was collected from numerous reports from various organizational institutions whose responsibility is to monitor and present data on healthcare expenditures and their relation to taxes. Therefore, by means of exploring these valuable data resources, the relevant data on tobacco taxation within the USA and health care expenditures in this country in the period of 2010-2013, were selected to operate with in modeling and regression analysis in STATA.
The data on health care expenditures (HCE) and tobacco taxes amounts collected is represented in the Table 1:
Table 1.
Tobacco Taxation and Health Care Expenditure in the USA in the period of 2010-2013.
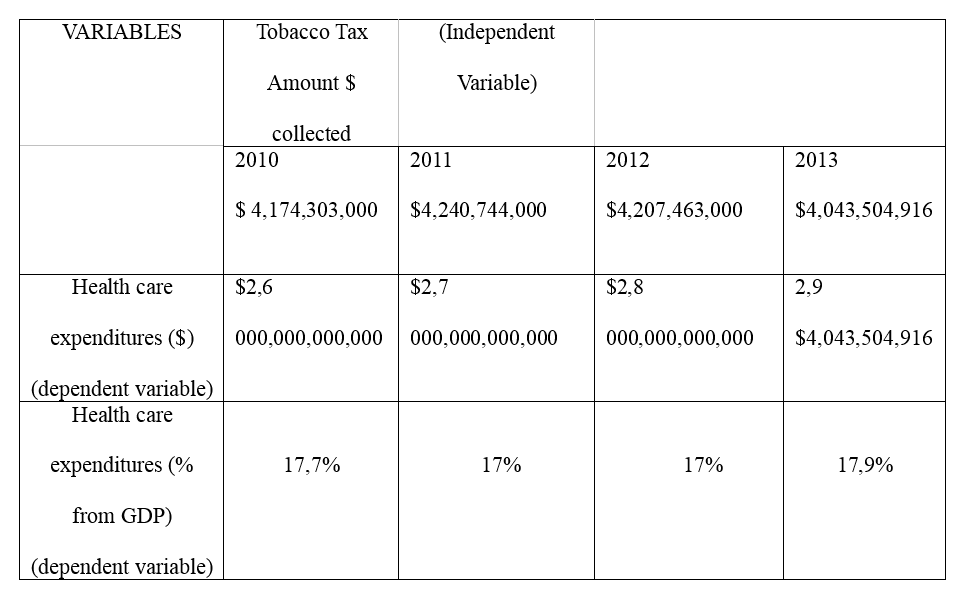
In this table tobacco tax amount for each year is represented as an independent variable, and health care expenditures are represented as a dependent variable.
Table 2. Smokers by Race/Ethnicity
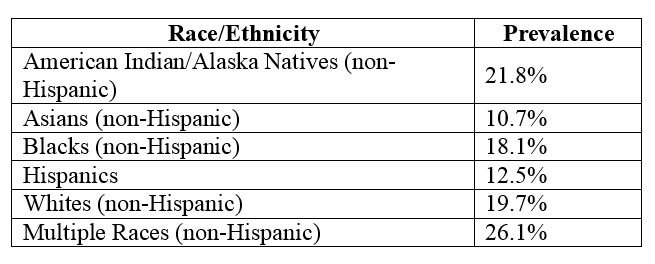
Source: Cigarette Smoking in the United States. Centers for Disease Control and Prevention, Retrieved from http://www.cdc.gov/tobacco/campaign/tips/resources/data/cigarette-smoking-in-united-states.html
Table 3. Smokers by gender.
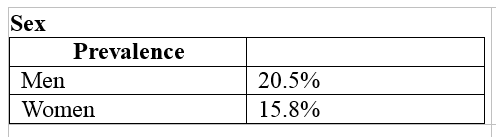
Source: Cigarette Smoking in the United States. Centers for Disease Control and Prevention, Retrieved from http://www.cdc.gov/tobacco/campaign/tips/resources/data/cigarette-smoking-in-united-states.html
Table 4. Smokers by age
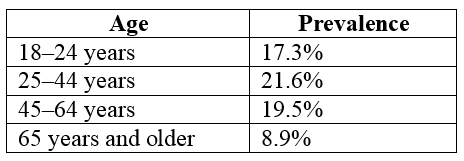
Source: Cigarette Smoking in the United States. Centers for Disease Control and Prevention, Retrieved from http://www.cdc.gov/tobacco/campaign/tips/resources/data/cigarette-smoking-in-united-states.html
Table 5. Smokers by education.
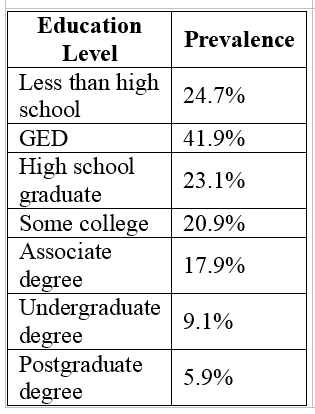
Source: Cigarette Smoking in the United States. Centers for Disease Control and Prevention, Retrieved from http://www.cdc.gov/tobacco/campaign/tips/resources/data/cigarette-smoking-in-united-states.html
Table 6. Smokers by income status
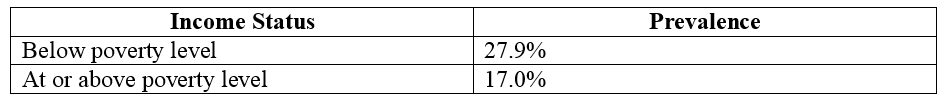
Source: Cigarette Smoking in the United States. Centers for Disease Control and Prevention, Retrieved from http://www.cdc.gov/tobacco/campaign/tips/resources/data/cigarette-smoking-in-united-states.html
The independent variable gains independence as it is an event that is not adjusted according to some regular circumstances. The thing is that amounts of collected taxes from cigarettes depend only on sales that are irregular. On the contrary, the dependent variable is health care expenditures in the period of 2010-2013 that depends on the amount of taxes collected.
Explicitly, there is a close relationship between tobacco taxes collected and health care expenditures. Many healthcare programs are regularly financed on the basis of tax benefits. Therefore, as a rule, the more taxes local governments gain, the more they spend on smoking related disease treatment and prevention. This relationship can be analyzed both in the context of the overall health care expenditures and according to the GDP value. The best chosen way is to provide the analysis after accomplishing simple mathematic modeling followed by the OLS regression analysis performed in STATA software.
The mathematic model will be related to the statistical experimental approach. The model is a function between x (independent variable) and y (dependent variable) that are in a close relationship with each other in terms of values. Particularly, dependent variable is an event that is expected to be changed when independent variable is meant to be modified. Presumably, when tobacco tax amounts collected values are changed, the values of healthcare expenditures are modified. In this relation, regression analysis will be later applied for the input values of the function.
In regard to this interrelation in the GDP % approach, the rise of healthcare expenditure amounts is visible in the recent years, in the period of 2010-2013. It equals up to 17,9% that is very high in comparison with other countries of the world. Since GDP values are high in the USA, healthcare expenditures tend to increase in amounts year by year until they irresistibly reach very high values.
According to the basic multiple regression model, the relationship between x and y should be the following: y = ax + bx2 + cx3 + e, where y is the dependent variable (HCE) and x is the independent variables (cigarette tax). E is considered to be the rate of "error" in this model.
This way of mathematic modeling contains drawbacks of an “error”; however, it gives an explanation and provides key approach to this model aimed at tracing the relationships between dependent and independent variables, practically calculating efficiency of regression analysis.
In this empirical study, the data will be simulated with the help of the STATA simulation software tools. This software allows enlisting the data according to the variables in tables in order to get the required results since the process of simulation is completed. It is a good way to start with the collected data input and later move on to a simple regression analysis according to the numeric data values simulation.
The chosen mathematic model allows providing both linear and interlinear regression analysis in several dimensions, both including the GDP % values and bringing up the amounts spent on healthcare in the analyzed period of time. The chosen model predetermines inclusion of the percent of national economy (GDP) in the USA according to the common standards of analysis, tracing the tendency without including these values into STATA regression analysis. However, GDP values in relation to the healthcare expenditures are of a great importance according to the perception of the power of the U.S. national economy and amounts spent on healthcare. In fact, many residents who are in need of the healthcare services can get access to the best opportunities to care about their health, even if they have no healthcare insurance. The fact is that the government takes care about the health of the nation, as it is one of the most important key values that help achieve goals and work for the benefit of the country.
This empirical study will present the simulated data in order to understand the benefits that Americans get from the practical implication of tobacco taxes for the health benefits of the nation. It will also be good to find popular trends and efficiency in the relationship between tobacco taxation as one of the benefits of healthcare, and household income that people should have to deal with daily. STATA will help to combine the data and reveal the results to prove the hypothesis and tendency. This can be achieved by means of putting up values into combinations.
IV. Data and Descriptive Statistics
4.1. Data Sources
The data for this paper was collected from the independent sources that may be treated as valuable resources according to their reliability and validity. For instance, the empirical data related to tobacco taxes were collected from national profile organization reports in order to get an opportunity to evaluate the data in an appropriate way. The reports allowed learning how the estimated data was changing in the period of 2010-2013, and how important it was in the process of healthcare development. Since in the recent years, the healthcare expenditure in the USA has risen up to 18% of the total spent from GDP, the estimation is possible according to this criterion as well. However, it was decided to make the direct data assessment using independent and dependent variable values based on the data reports from the trusted resources.
4.2. Sample
The data sample is presented by health care expenditures (HCE) as a dependent variable, and tobacco tax amounts collected is presented as a independent variable. The relationship between dependent and independent variable resembles the relationship between x and y in an axis. Therefore, if x changes, y changes as well, according to the simple mathematical modeling that was described in details in the Empirical Specification chapter.
The sample is provided with the elasticity for changes, as both variables are interdependent. That is why they can be considered dynamic and should be evaluated according to the chosen mathematical model.
The chosen sample presents the adequate data from different organizations, whose profiles are available both online and offline. They are dedicated to the idea of supporting the struggle against kids smoking and spreading of cancer and heart diseases caused by smoking. It is explicitly presented in all reports that were examined and explored for the benefit of this empirical study.
4.3. Discussion of Variables
Independent variable of x will mark the amounts of $ collected from tobacco taxes. Dependent variable of y will mark the amounts of total expenditure for healthcare in the USA in the period of 2010-2013. STATA simulation of data will be used in order to get the appropriate results and make conclusions. For instance, in STATA, the variable of x will be substituted with tob_tax, and the variable of y will be substituted with HCE.
The STATA will work strictly according to the basic principles of data simulation that is provided in this section step by step.
Step 1. Create independent and dependent variable. Although, in this software, there is no priority for variables to be created at first, independent and dependent variables may be created in a desirable order. Therefore, the variable of tob_tax will be created in the first place, and then the variable of HCE will be created in the Data Editor.
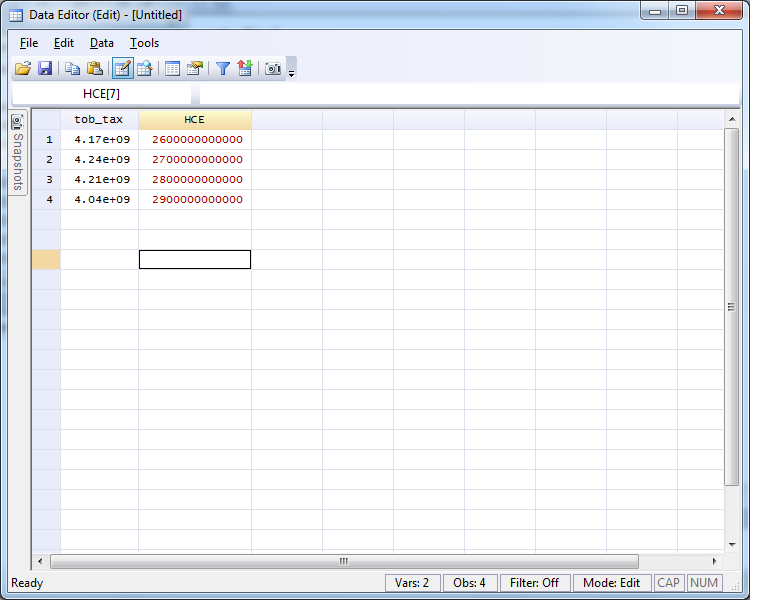
It is very important that both variables have the same numeric type of properties. HCE and values are colored in red, because they belong to the string data type. That is why encoding command should be applied in order to set up the data in the right way.
Step 2. Data input. Both dependent and independent variables should have specific numeric values according to the arrangement of the data sample. In this relation, the command of the data input in the tables is required to be accomplished. The tables of data may be imported from the raw files and excel sheets. Unfortunately, Microsoft Word data tables do not meet STATA requirements and cannot be imported automatically.
There are two alternatives to import the data: using a file and manually. When it is required to operate with the large amounts of data, it is more useful to import data using files. However, when a simple model is used in this process, it is better to get familiar with the Data Editor and input the data in STATA manually.
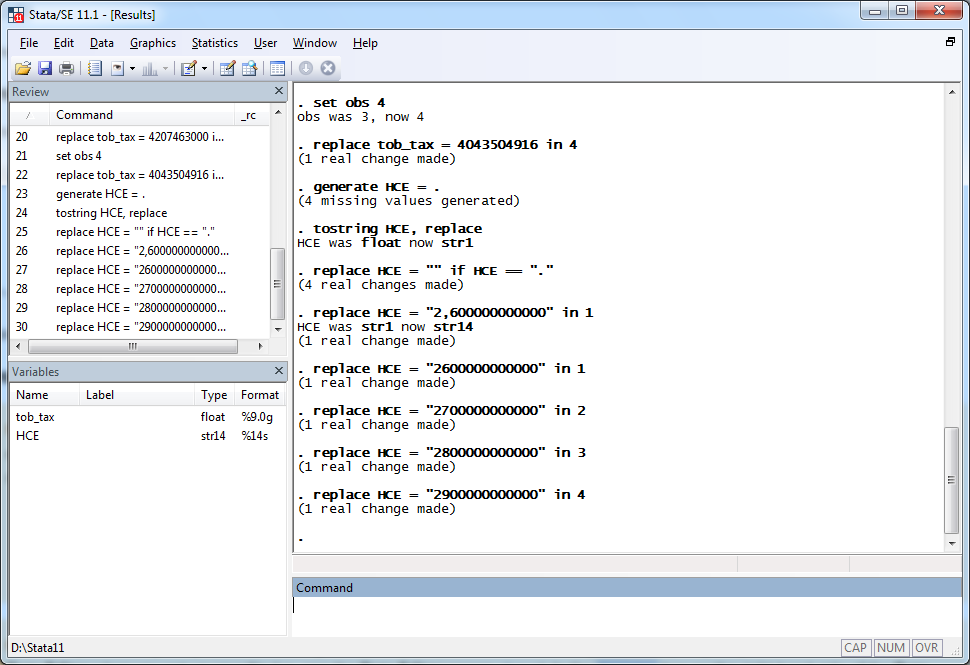
Step 3. Rename HCE to hce. The process of renaming is followed by the simple STATA rename command.
Step 4. HCE variable encoding. This command was be input in the Command field in STATA in order to change the property type of the dependent variable from string to numeric so that both variables are in harmony with each other according to the numeric data type of their properties.
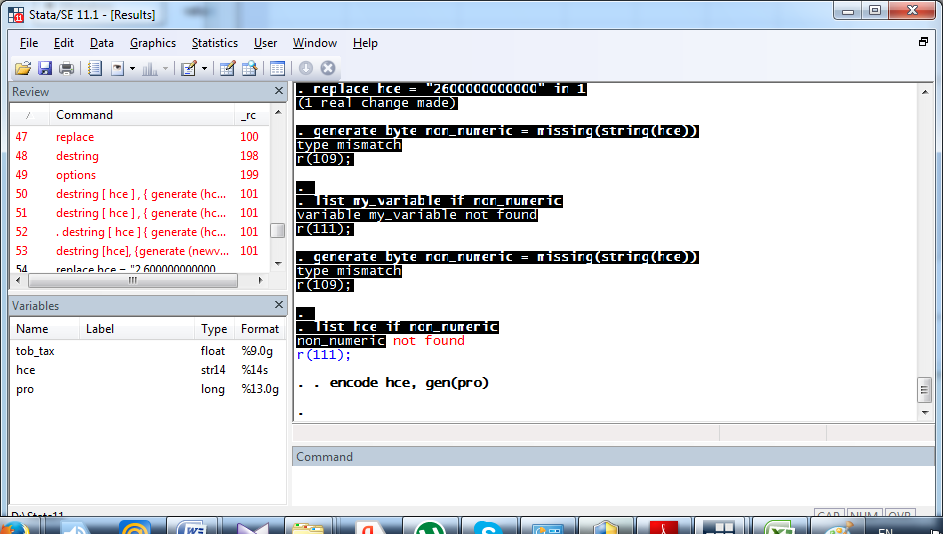
In this relation, the new additional variable of pro was created, as an interchangeable and alternative variable for the dependent variable. The encoding command in STATA is simple, and it gives an opportunity to adjust the property types for both dependent and independent variables in the array of data.
Step 5. The final step of operating with the STATA do-file is to run a linear regression. It will help understand the relationship between dependent and independent variables practically. This step consists of two substeps.
Running the command Statistics > Linear models and related > Linear regression, the following table will help to choose pro as a dependent variable, and tob_tax as an independent variable.
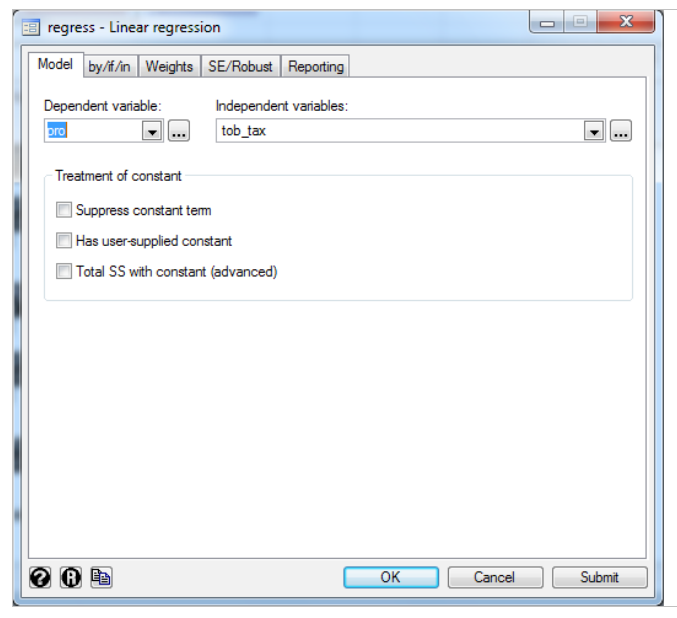
By pressing OK, the linear regression is put into run. The results of this linear regression will be presented in the next section in order to get them analyzed and discussed in an appropriate way that will help reach consistency in this empirical study. OLS regression is the way of overcoming difficulties in the data simulating according to the chosen sample and mathematic modeling described above.
V. Results and Findings
In general, this paper was supposed to find out the relationship between the two types of empirical data. These are tobacco taxes amounts collected and the related healthcare expenditures in the USA. The model was chosen correctly, and the simulation tool of STATA helped reach results by means of running the linear model for this research. It helped understand the relationship between dependent and independent variables, tracing the difficulties in their perception in the social context.
Therefore, running STATA for the linear regression provided researchers with the following regression Table:
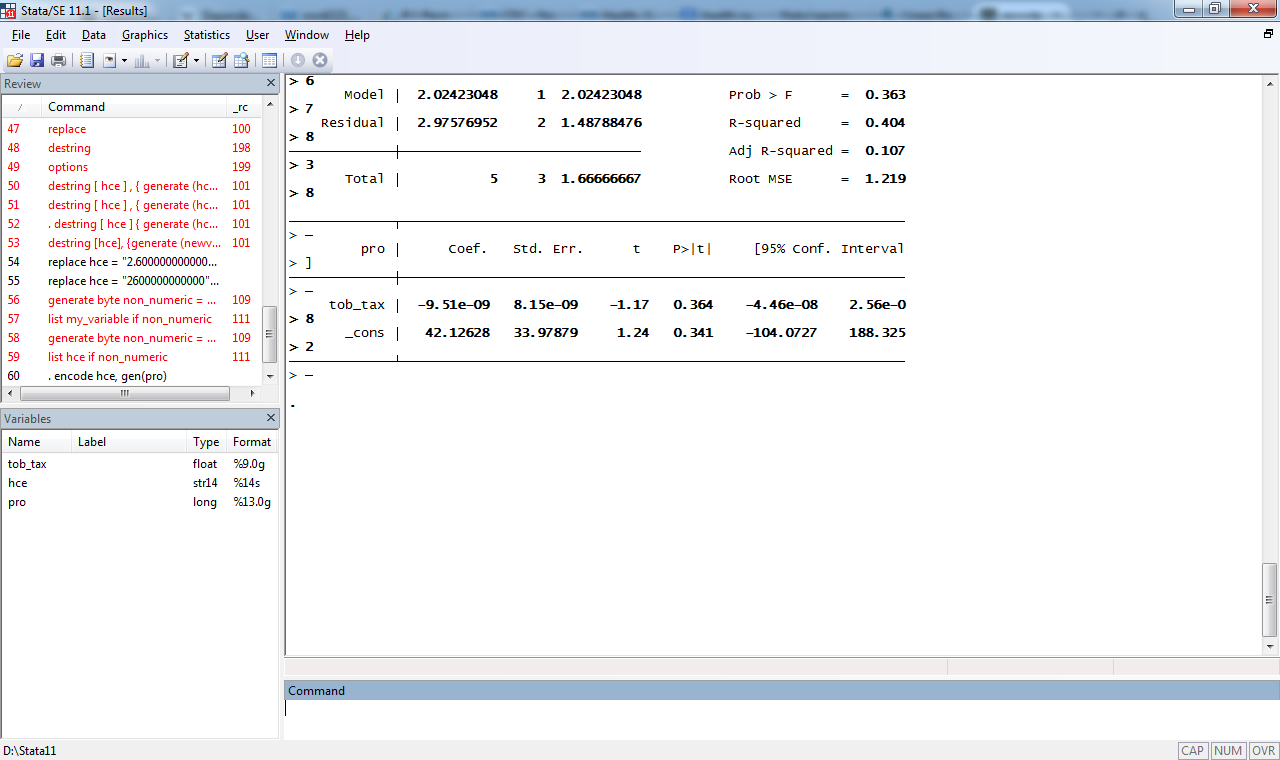
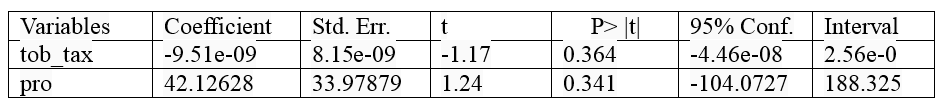
Table 7. OLX regression results.
Prob > F = 0,363
R-squared = 0,404
Adj. R-squared = 0,107
Root MSE = 1.219.
Table 7 provides the estimation of the discussed values. Health care expenditures is the dependent variable, while cigarette tax is the independent variables. The estimated value of R2 is 0.404 which means that the independent variable in our model predict 40.4% of the variation in the dependent variable. The value of F-statistic and corresponding probability value is 0,363 which is less than 5 %. This result shows the significance of this model.
The estimation of the results leads to the fact that the period of 2010-2013 was marked by two shifts in the collected tobacco taxes. The first sub-period is 2010-2011, when the amount of tobacco taxes collected tended to rise, and the second period is 2011-2013, when amounts from tobacco taxes tended to fall. However, in relation to the dependent variable of y, the healthcare expenditures tended to rise irrespectively of fluctuations of the independent variable. The dynamics of rise in HCE rate is positive and stable. Each year in the period of 2010-2013, healthcare expenditures rose by $0.1 trillion. Positive dynamics of HCE rates rise is explicitly traced on the example of GDP % total expenditures from the healthy national economy of the USA. This fact evokes hope that healthcare will still be one of the priorities for the US government, as the well-being of people is very important in the changing globalized world and stressful circumstances, in which people have to live and work.
The linear regression analysis has shown that there is a relationship between dependent and independent variables. However, the healthcare expenditures as a dependent variable also depend on the decisions of the government. And although taxes are collected from the cigarette sales and should be spent on the related anti-smoking programs and project, this paper is to analyze the total amount of HCE in the period of 2010-2013, when variables are set according to the proper modeling and data sheets.
The data sample for this empirical study includes values that are specific, definite and numeric. Therefore, it should be possible to sort them out according to the given criteria rather than give each of the value its specific explanation. However, it became possible to manage two simple arrays of data in order to get familiar with the best features of STATA in relation to its operation with big numbers, preserving the numeric value for each of them.
VI. Conclusion
This empirical study was dedicated to the relationship between cigarette taxes and healthcare expenditures in the USA in the period of 2010-2013. The aim of this paper was to find a relationship in an experimental way.
In order to reach this aim, the array of data was collected from the trusted resources, many of which were reports of organizations aimed at improving the healthcare field using both direct funding and volunteer efforts. Thereafter, the array of data was described in an appropriate way by using specific terms. Based on the division into the dependent and independent variables, mathematic modeling was used to find the expressions of x and the expression of y in their interdependence. Thereafter, the data was transferred to the STATA software and simulated in the OLS regression analysis. The steps to follow are presented in this paper in order to illustrate specific measures that researchers were meant to take to reach success and get the STATA tables of the linear regression.
The data was analyzed, and the following facts were found out:
- The hypothesis was true that the dependent variable representing the HCE rates and independent variable representing the amount of tobacco taxes collected in the USA in the period of 2010-2013 are in a close relationship.
- There are two sub-periods between 2010 and 2013. In the first period of 2010-2011, HCE and the cigarettes tax amounts collected tended to rise. And in the second period of 2011-2013, the amounts of cigarette taxes collected tended to fall, while the progress of the HCE remained the same.
All these discussed facts lead to a conclusion that HCE is of priority in the USA, so health care expenditures increase year by year, no matter if amounts of cigarette sales tax collected rise or fall.
VII. Future Research Perspectives
The regression model created in STATA helps trace variables in the context of their adjustment to the practical situation with healthcare expenditures. The government of the USA takes much care not only about the expenditures but also their control according to the created budgets for different projects. In fact, it can be put in the context of the future research that will be conducted to analyze the perspectives of control over the spent budget with the help of mathematic modeling and productive regression analysis.
The costs spent on the healthcare and methods of their control may be divided into independent and dependent variables in order to provide a better understanding of the mechanisms of control and their effectiveness in different situations and contexts, according to which they are set up and organized in a proper way. The perspective study may be based on the empirical data collected from the valuable trusted resources that are available both in libraries and online.

